
If you have ever searched for information about hair loss, you have almost certainly seen the Norwood scale, the familiar seven-stage chart used to describe male pattern hair loss. It has been the default reference point for half a century. But a growing body of measurement science is asking whether sorting something as gradual and individual as hair loss into seven fixed categories was ever the right approach, and what a continuous density score can capture that a stage label cannot.
What is the Norwood scale and what does it actually measure?
The Norwood scale, formally the Hamilton-Norwood classification, sorts male pattern hair loss into a small number of visual categories based on hairline recession and crown thinning, originally proposed in 1975 as a way to standardise how clinicians describe hair loss severity.2 A related system, the Basic and Specific classification, later extended this idea to work for both men and women, combining hairline shape with density variation across the scalp.3
Both systems share the same underlying approach: a trained observer looks at a scalp, compares it to a set of reference images, and assigns it to the closest matching category. That approach has real strengths, it is fast, it needs no equipment, and it gives clinicians a shared vocabulary. But it also means the result depends entirely on one person’s visual judgement at one moment in time.
How reliable is Norwood staging, really?
Less reliable than most people assume, even in expert hands. A study asking seven dermatologists and sixteen dermatology residents to independently stage the same set of photographs found the concordance between appraisers unsatisfactory, with an intra-class correlation coefficient of just 0.63 to 0.68.1 A second part of the same study asked raters to score the same photographs again three months later, and found repeatability was poor, with no meaningful difference between the accuracy of dermatologists and residents in training.1 The study’s own conclusion is blunt: reliability of the Hamilton-Norwood scale is unsatisfactory even in the hands of expert appraisers.
This is not an isolated finding. Separate research building an AI-based alternative to visual staging cited the same underlying problem, noting that traditional expert grading exhibits inherent inter-observer variability, with dermatologists achieving only 65 to 78% reproducibility for Norwood-Hamilton staging.5 Put plainly, two experienced clinicians looking at the same scalp can, and regularly do, arrive at different stages.
What’s the difference between a stage and a score?
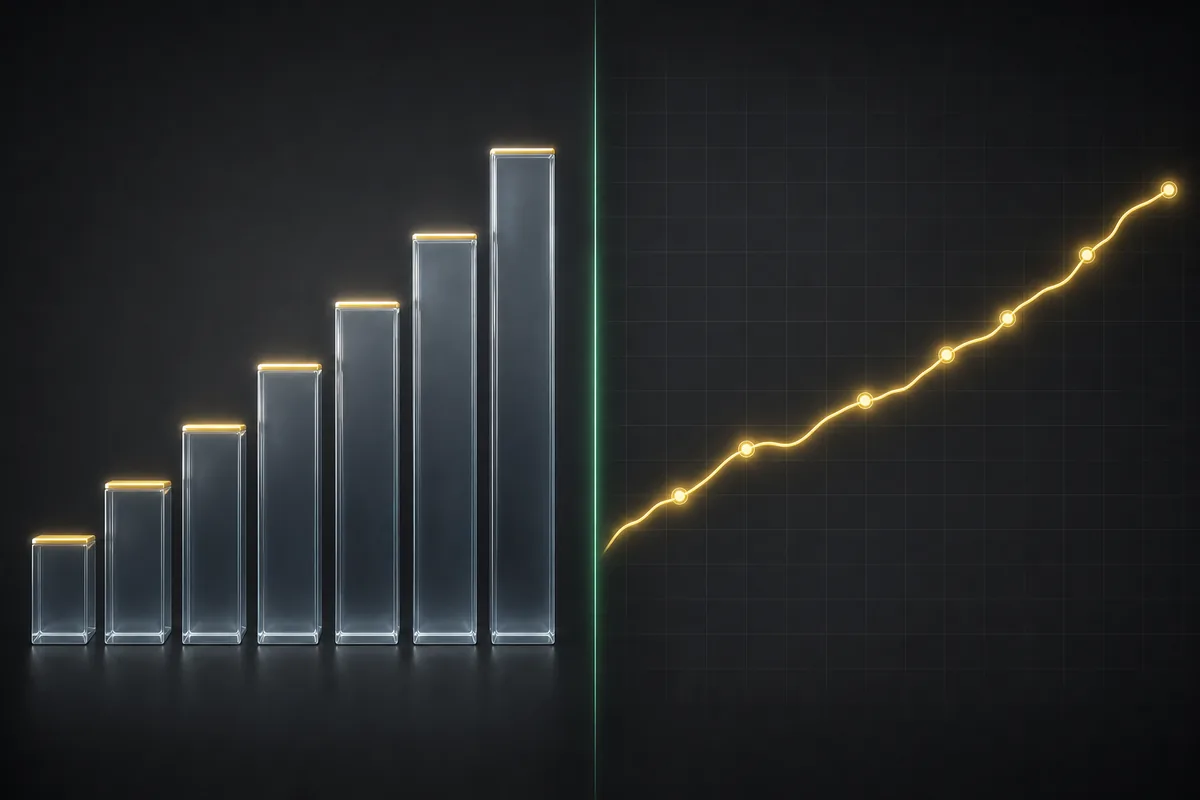
A stage is a category. A score is a measurement. That distinction sounds small, but it changes what the number can tell you. Quantitative trichoscopic analysis, which measures hair density and shaft diameter directly rather than matching a scalp to a reference photo, has been described in the clinical literature as non-invasive, straightforward, and easily reproducible, particularly suited to follow-up tracking and larger studies precisely because it produces a continuous number rather than a category.4
That said, “quantitative” is not automatically interchangeable across every method. A comparison of two different density measurement techniques used on the same subjects, the phototrichogram and the unit area trichogram, found the two methods produced meaningfully different density values on identical scalps, 181 versus 237 hairs per square centimetre on average.6 The lesson is not that quantitative measurement is unreliable, it is that consistency of method matters. The same device, the same conditions, the same technique, tracked over time, is what makes a density score meaningful. Switching methods partway through defeats the purpose just as surely as relying on a single subjective glance.
Is it normal to have thinning hair in your 30s?
Yes, and this is exactly where the stage-versus-score distinction starts to matter in practice. Hair loss risk rises meaningfully with age, and early-stage thinning in your 30s sits well within a normal, common range rather than being unusual or alarming on its own. The problem with relying on Norwood staging alone at this point is that early change is often too subtle to cross a visible category boundary, someone can be genuinely losing density month over month while still technically sitting in the same Norwood stage, because the scale simply was not built to register small, gradual shifts.
A continuous density score does not have that blind spot. It does not need a change to be large enough to look like “a different category” before it registers. It just needs to be measured consistently.
Why a trend beats a single snapshot
This is the practical argument for tracking over staging. A single Norwood assessment is a snapshot, one judgement, at one moment, compared against fixed reference images. A density score tracked over time works more like a running measurement: establish your own context, take a first reading, take a later reading, and watch the trend between them. Four simple stages, but they answer a fundamentally different question than a one-off stage assignment ever could. A stage tells you roughly where you are. A trend tells you whether you are changing, and how fast.
A note on what an app can and cannot do here. Scalp Score, the app from Orga Hair, does not measure density: your Scalp Score is an estimate from your own answers, and the Photo Journal keeps your photographs in order so you can compare pictures taken the same way over time. A measured density figure comes from trichoscopic methods like those described above.
Frequently Asked Questions
Can an app actually tell you what’s wrong with your scalp?
Not on its own. An app can help you keep track of what is changing, not why; that context still comes from a GP or dermatologist.
Does a low Norwood stage mean I have nothing to worry about?
Not necessarily. Given the scale’s documented reliability limits and its coarse category structure, a stable stage does not rule out gradual density change happening underneath it.
Should I stop using Norwood staging altogether?
No, it remains a useful shared clinical shorthand. The point is not to discard it, but to pair it with continuous measurement rather than relying on it alone.
References
- Guarrera, M., & Rebora, A. (2009). Reliability of Hamilton-Norwood classification. International Journal of Trichology. Read study
- Norwood, O. T. (1975). Male pattern baldness: classification and incidence. Southern Medical Journal, 68(11), 1359-1365. Read study
- Lee, W. S., et al. (2007). A new classification of pattern hair loss that is universal for men and women: basic and specific (BASP) classification. Journal of the American Academy of Dermatology, 57(1), 37-46. Read study
- Comparison between Trichoscopic and Histopathological Evaluations of Hair Parameters. Clinical, Cosmetic and Investigational Dermatology. Read study
- Xi, H., Yuan, X., Yuan, H., Lin, K., Wang, C., & Wang, Z., & Zhang, J. (2025). Enhanced stratification of male pattern hair loss using AI through novel loss region ratio analysis. Scientific Reports, 15, 38280. Read study
- Comparative evaluation of scalp hair by phototrichogram and unit area trichogram analysis within the same subjects. (1993). Acta Dermato-Venereologica. Read study